Risorse energetiche
Type of resources
Categories
Topics
Topics
Keywords
Contact for the resource
Provided by
Years
Formats
Representation types
Update frequencies
status
Scale
Resolution
pubblicaAmministrazione
-

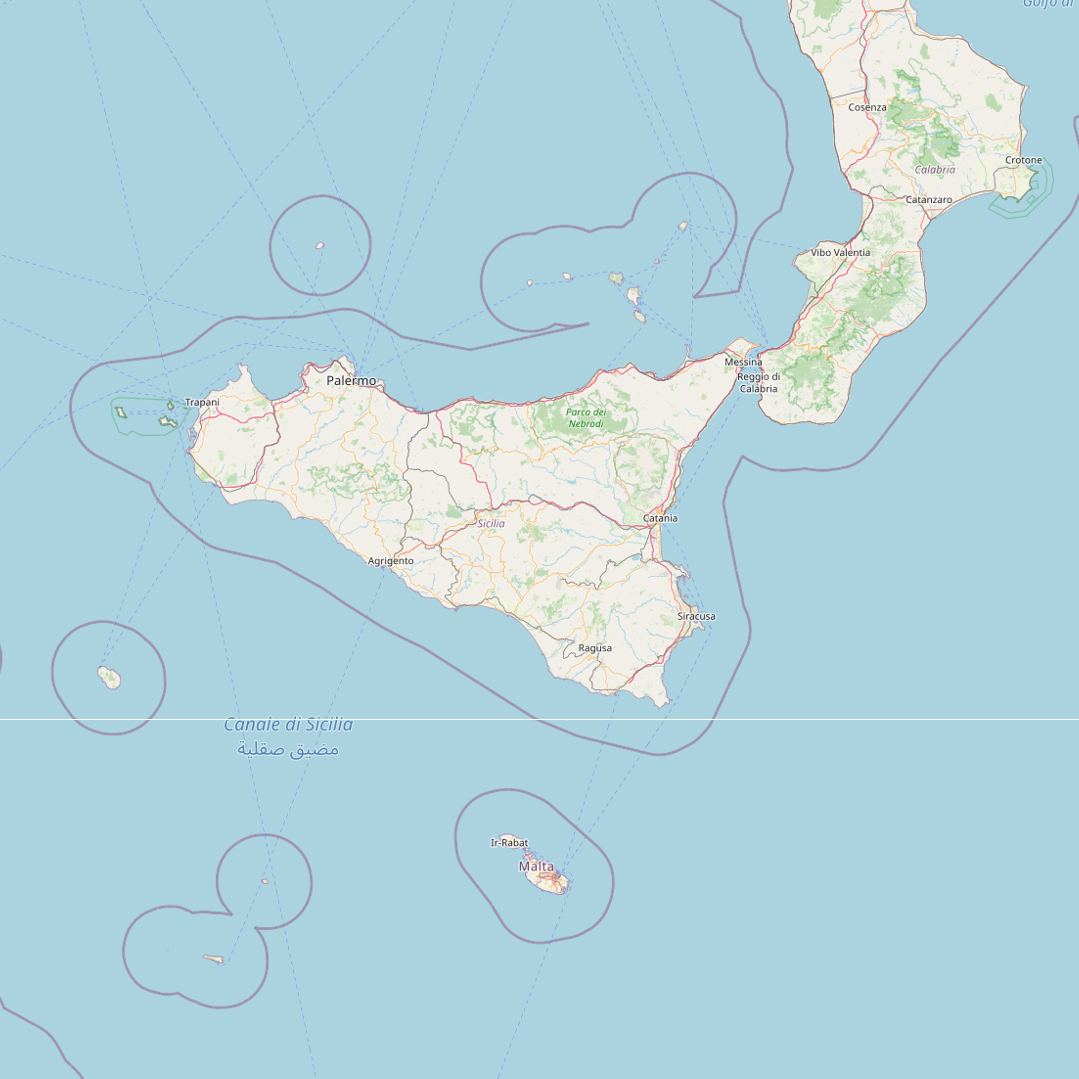
Distribuzione della temperatura a 1000 m di profondità sotto il piano campagna della regione Sicilia, calcolato sulla base della modellistica termica
-
Distribuzione della temperatura a 1000 m di profondità sotto il livello del mare della regione Sicilia, calcolato sulla base della modellistica termica
-
Calore in posto (Heat in Place) della Regione Calabria in PJ
-

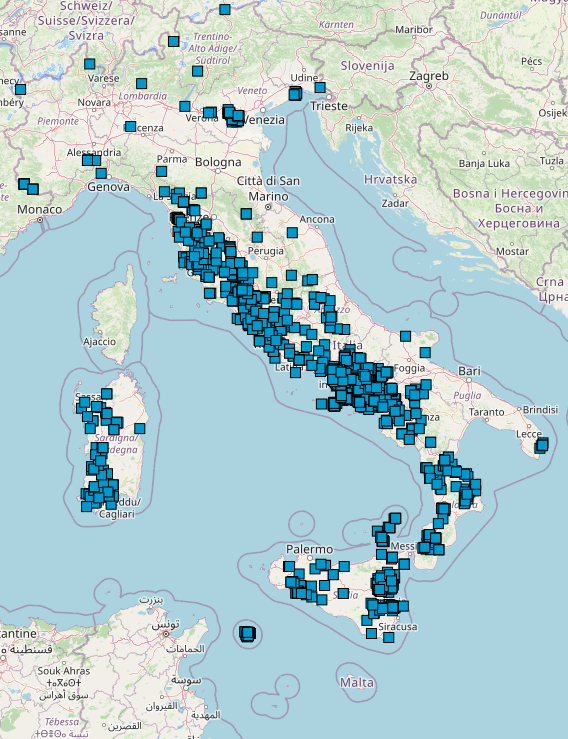
La Banca Dati Nazionale Geotermica (BDNG), realizzata nel 1993 dall'Istituto Internazionale per le Ricerche Geotermiche di Pisa del Consiglio Nazionale delle Ricerche al completamento dell’Inventario delle Risorse Geotermiche predisposto, ai sensi della legge n. 896 del 1986, è il cuore di Geothopica, l'Infrastruttura dati geotermici Italiani. L’aggiornamento dei dati di sottosuolo deriva in gran parte dai due progetti nazionali coordinati dal CNR, VIGOR e Atlante Geotermico del Mezzogiorno d’Italia, dedicati a regioni del Sud Italia. Oltre a contenere i dati stratigrafici e termici del sottosuolo, raccoglie dati di interesse geotermico provenienti da sorgenti termali, manifestazioni gassose e pozzi inclusi numerosi dati geochimici provenienti da letteratura scientifica. La BDNG è un utile strumento in tutti i progetti che necessitano di informazioni del sottosuolo, quali ad esempio quelli geotermici e di stoccaggio della CO2, inserendosi perfettamente nelle ricerche portate avanti dall’Istituto di Geoscienze e Georisorse che ne cura la compilazione. Questo database NON è inteso del tutto esaustivo, sia per quanto riguarda tutti i possibili dati geotermici pubblici che per l'inclusione di tutti i dati possibili e le informazioni da ogni singolo progetto geotermico. Piuttosto, è destinato a fornire all'utente/lettore un database geotermico pubblico il più aggiornato e meglio organizzato possibile. Ci siamo sforzati di rendere il database esente da errori e inesattezze di informazioni, per quanto possibile, ma non siamo responsabili di errori ed omissioni nelle fonti di dati pubblicati o forniti che sono state utilizzate.
-

Surface Heat Flow Contour Map of Italy
-

The map "Geothermal field" shows the total amount of installed capacity (in MWe) and produced energy per year (in MWh/y) for all the countries currently using geothermal resources for electricity generation. The map has been developed using the Global Geothermal Energy Database (GGED) of the International Geothermal Association (IGA) [E. Trumpy, R. Bertani, A. Manzella, M. Sander - The web-oriented framework of the world geothermal production database: a business intelligence platform for wide data distribution and analysis - Renew Energy, 74 (2015), pp. 379–389]. The GGED can be accessed through the IGA web site, http://www.geothermal-energy.org, under the section Geothermal Energy - Geothermal Energy Database. The map has been distributed by the Institute of Geosciences and Earth Resources of the National Research Council of in Italy (CNR - IGG)
-

The map of "geothermal direct use by country" shows the total amount of installed energy (in MWth) and annual use (in TJh per year) for countries using geothermal heat for different uses (e.g., Individual space heating, District heating, Air conditioning (cooling), greenhouse, Fish farming, Animal farming, Agricultural drying, Industrial process heat, Snow melting, Bathing and Swimming, Geothermal heat pumps, Other uses). The map has been developed using the Global Geothermal Energy Database (GGED) of the International Geothermal Association (IGA) [E. Trumpy, R. Bertani, A. Manzella, M. Sander - The web-oriented framework of the world geothermal production database: a business intelligence platform for wide data distribution and analysis - Renew Energy, 74 (2015), pp. 379–389]. The GGED can be accessed through the IGA web site, http://www.geothermal-energy.org, under the section Geothermal Energy - Geothermal Energy Database. The map has been distributed by the Institute of Geosciences and Earth Resources of the National Research Council of in Italy (CNR - IGG)
-

The World map of geothermal field shows all of the know geothermal fields across the world. For each geothermal field, the map highlights the current installed capacity (in MWe) and produced energy per year (in MWh/y). The map has been developed using the Global Geothermal Energy Database (GGED) of the International Geothermal Association (IGA) [E. Trumpy, R. Bertani, A. Manzella, M. Sander - The web-oriented framework of the world geothermal production database: a business intelligence platform for wide data distribution and analysis - Renew Energy, 74 (2015), pp. 379–389]. The GGED can be accessed through the IGA web site, http://www.geothermal-energy.org, under the section Geothermal Energy - Geothermal Energy Database. The map has been distributed by the Institute of Geosciences and Earth Resources of the National Research Council of in Italy (CNR - IGG)
-

Many documents are defining a context for geothermal exploitation in a country. As the administrative levels and the geometry of that “geothermal exploitation context” could differ from one country to another a geothermal management area class has been defined. Dataset FAKE built to demonstrate, with a larger dataset, some analytic functionalities.
 GeothermCatalog